
Subscribe to our Blog
We're committed to your privacy. SayOne uses the information you provide to us to contact you about our relevant content, products, and services. check out our privacy policy.


Generating table of contents...
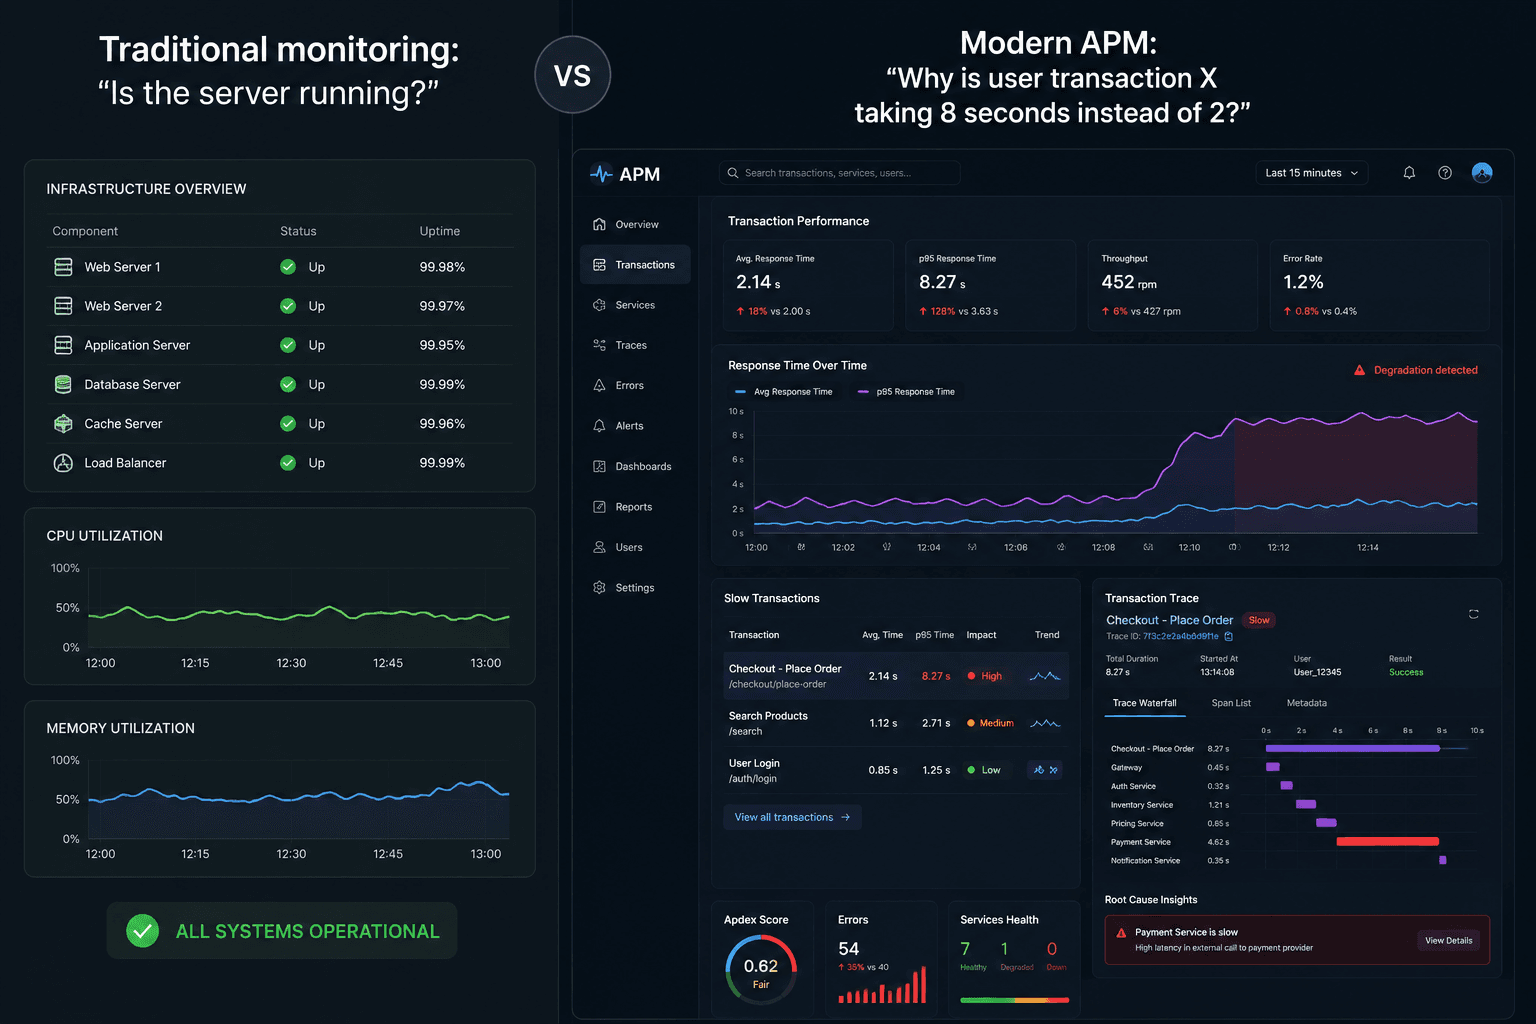
Have you invested in the latest Application Monitoring (APM) tools, but still realize issues after your customers complain? This paradox of missing critical application issues despite having a performance monitoring system is becoming a more common issue that businesses are facing today. This blog aims to break down the reasons behind the performance issues that businesses are facing despite APM. But, before we delve into that, let’s begin by understanding what APM is.
APM is the process of observing and measuring how applications behave in live environments. Real APM goes beyond uptime checks and tracks user experience metrics, infrastructure dependencies, and application performance analysis at the code level.
Modern APM monitoring spans multiple layers, including web application performance monitoring, cloud application performance monitoring, and infrastructure observability. Yes, this vast coverage creates a false sense of security.
There are three main ways in which application performance issues manifest within production systems: Visible issues 20% of issues are easy to spot as they appear directly in the system behaviour. Issues such as server downtime, 404/500 errors, API failures, and database connection failures belong to this category. Even though these issues are of high severity, they can be easily detected and fixed quickly.
Everything looks fine on the surface, while something is subtly degrading underneath. These issues lead to intermittent slowdowns and successive failures and are often missed by APM. As they accumulate silently, they become visible only after they significantly damage performance. Hidden issues represent almost 70% of real-world problems.
Issues such as slow page load times, lag in UI interactions, delayed search results, high time to first action, uneven performance across devices, etc., are most important to businesses. 10% of the application performance issues belong to this category. They directly affect retention, conversions, and user satisfaction, even when the backend remains strong.
The monitoring system fails to detect issues on time because of the following reasons:
The complexity of your infrastructure directly influences the effectiveness of your monitoring. To keep up with the modern infrastructure, today’s performance monitoring system should track dynamic compute environments, multicloud, and distributed data systems.
However, as complexity increases, monitoring requirements also expand:
Your performance monitoring application might generate 10,000 metrics. Your application performance management team can understand maybe 50 simultaneously. That's a 200:1 ratio of data generated to data analyzed. The architecture built for monolithic applications is now expected to manage distributed systems.
You might be surprised to know that web application performance monitoring probably doesn't measure most of what your customers actually experience. APM measures API response times, server-side latency, backend processing duration, and database query performance.
What customers actually experience is:
For example, a user in Singapore on a 4G connection experiences a 15-second page load time. Your US-based monitoring infrastructure measures a 2-second API response time and shows everything as green. Your web application performance monitoring is measuring the last 1.3 seconds of a 15-second problem, leaving the rest undetected.
The geographic distance is another issue. Your application performance monitoring architecture probably assumes users are relatively close to your data centers with fast connections. A user in Southeast Asia on 4G experiences performance 5-10x worse than your monitoring predicts. But your dashboard shows green because the metric averages over all regions. Also, while 60% of traffic comes from mobile devices, your performance monitoring application probably tests from desktop environments or data centers. Mobile experience is 40-60% slower than what your monitoring predicts, and the blind spot affects the majority of your traffic.
Cloud infrastructure creates a new category of monitoring problems. These APM systems are expected to track infrastructure that changes state faster than monitoring can report.
If there's an issue with those new containers, it's already affected 5 minutes of user transactions. Also, the infrastructure state that caused the problem has likely already changed again by the time you see the alert.
The current approach to application performance monitoring has three fundamental limitations.
The gap between what you think you're monitoring and what you're actually catching isn't static, it's growing exponentially.
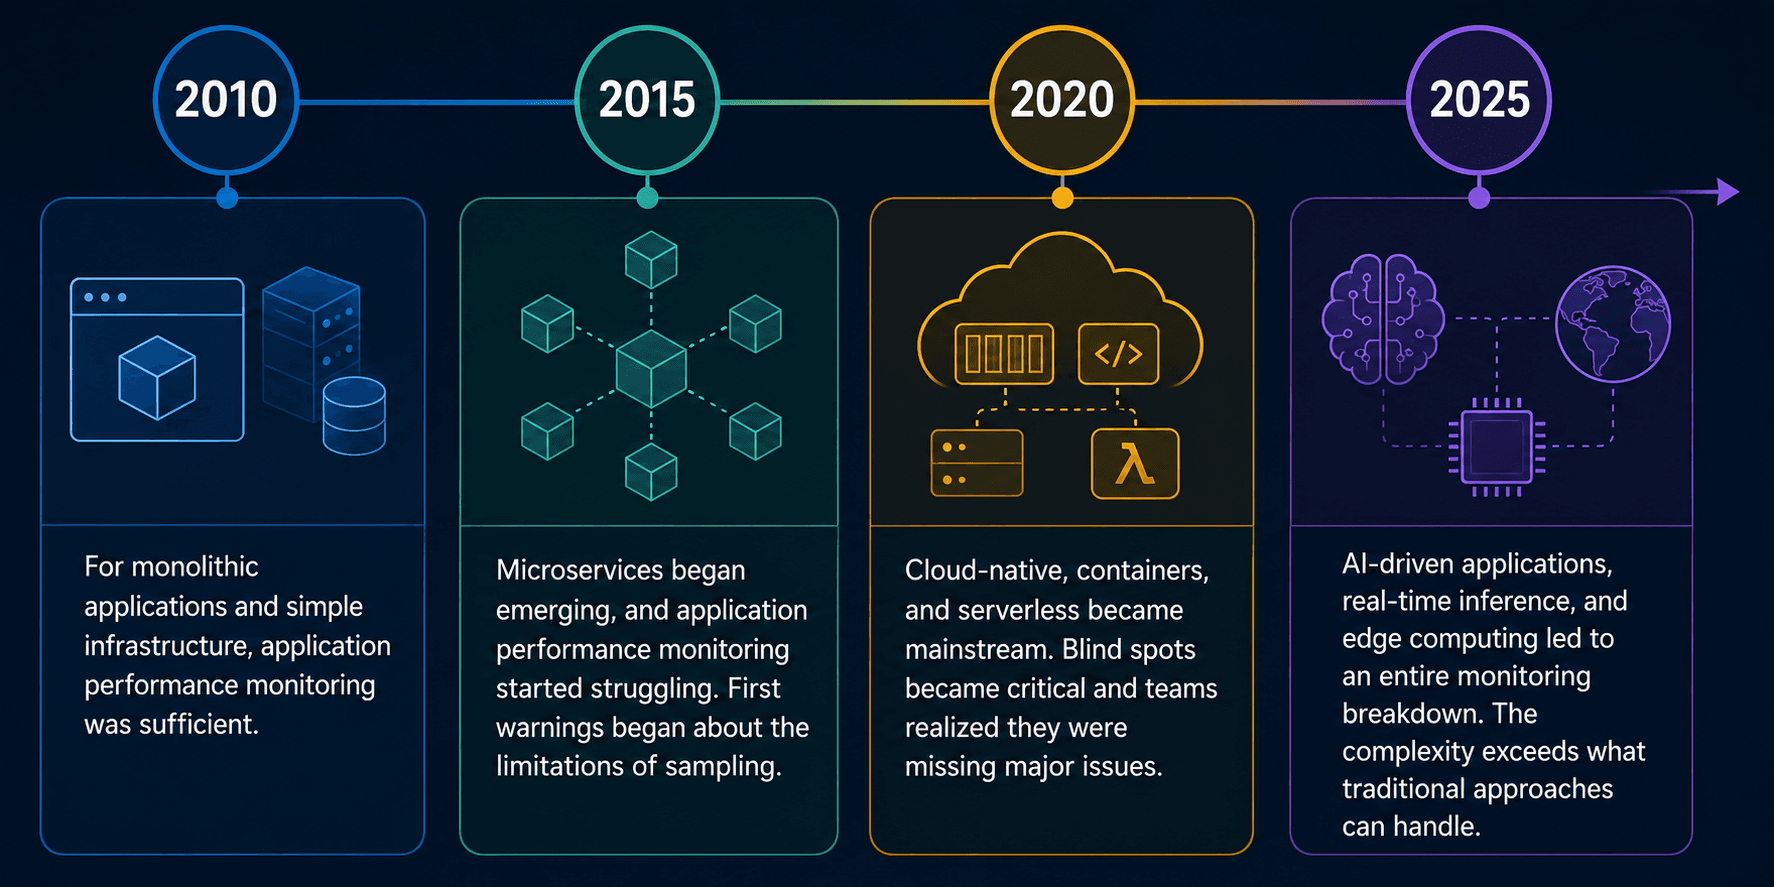
From 2020 to 2025, infrastructural complexity has increased exponentially along with interdependencies and data volume. However, the monitoring capability shows a linear growth. Organizations at this inflection point:
The next generation of performance monitoring applications requires fundamentally different capabilities:
These capabilities are not really a future promise; they are possible today with machine learning. But before you explore more, ask yourself these questions to reveal your blind spots. How many transactions does your application performance monitor actually see? If it's less than 10%, you have blind spots. When was the last time your monitoring caught an issue before customers reported it? If it's been more than a month, you have a detection problem. How many performance complaints came from customers vs. your alerts last quarter? If customers are reporting more issues than your monitoring is catching, you have a visibility gap.
If your answers reveal gaps, take it as an opportunity to learn, not to act immediately. Recognizing the limits of traditional APM performance is the foundation for exploring how machine learning can close those gaps.
We're committed to your privacy. SayOne uses the information you provide to us to contact you about our relevant content, products, and services. check out our privacy policy.


We collaborate with visionary leaders on projects that focus on quality