

Subscribe to our Blog
We're committed to your privacy. SayOne uses the information you provide to us to contact you about our relevant content, products, and services. check out our privacy policy.


Generating table of contents...
As your business expands, managing a complex web of microservices can become a real challenge. When one small component fails, it can create a ripple effect, leading to downtime and a frustrating experience for your customers.
The shift to microservices is now mainstream, with many organizations adopting this architecture to build scalable applications. For most tech leaders, microservices have become the default choice for new development projects, reflecting a fundamental change in how modern software is created.
As a business owner, you're likely using this approach to stay competitive. But how do you make sure every independent service is online and working as expected at all times?
This is where effective health checks come in. By setting up simple, automated status checks, you can keep an eye on each microservice and its dependencies, stopping failures before they ever reach your users.
Let’s explore how you can set up these checks in your own architecture.
Health checks are essential for any entrepreneur building a microservices-based business. In a setup made up of many independent services, a single failure can ripple through the entire application.
Health checks are special REST API implementations that validate the status of a microservice and its dependencies, such as databases, external APIs, and system resources.
These checks continuously monitor whether each service and its connections are working as expected, reporting a simple status like “UP” or “DOWN”. If all checks pass, the service is considered available; if any fail, it’s marked as unavailable, helping you react before users are affected.
Health checks can also interact with orchestration platforms like Kubernetes, enabling automated recovery actions such as restarting failed services or scaling resources as needed.
Within a microservices setup, individual pods and services communicate with each other and share resources like databases. Health checks keep these connections stable, allowing orchestration platforms to detect issues and initiate automated recovery, so the system maintains reliability and minimizes downtime.
Implementing effective health checks in microservices architectures helps maintain system reliability, scalability, and a positive user experience. As businesses move toward distributed systems to meet growing customer demands, managing multiple independent services becomes more complex.
Health checks are the foundation for keeping this intricate system running smoothly, allowing you to spot, diagnose, and resolve issues before they escalate into major outages.
As a business owner, hidden failures can disrupt operations or erode trust with your customers. Consider a scenario where your order processing service stops communicating with the payment gateway, and the issue goes unnoticed until customers start reporting problems.
Health checks provide real-time visibility into each service’s status, helping you catch failures such as unresponsive APIs or database disconnects before they affect your users.
This proactive approach reduces downtime and helps maintain your brand’s reputation for reliability.
When your business grows, your technology must keep pace, especially during traffic spikes or unexpected failures. Health checks integrated with orchestration platforms like Kubernetes allow for automated healing and scaling.
If a service instance fails, the system can restart it or create new instances to handle increased load. This automation ensures high availability and reduces the need for constant manual intervention, freeing you to focus on strategic growth.
Continuous delivery is essential for innovation, but deploying updates without disrupting users can be challenging.
Health checks make zero-downtime deployments possible by monitoring new service versions during rollout.
With strategies like blue-green or canary deployments, only healthy instances receive live traffic, ensuring smooth transitions and uninterrupted customer access.
Key Components of Effective Health Checks
Health check APIs play a key role in maintaining the reliability and transparency of microservices architectures. They act as the first alert system, notifying teams and automated tools of problems before they escalate.
When these APIs are thoughtfully designed, businesses can achieve higher uptime, faster recovery, and a better experience for users.
Many businesses encounter challenges with rolling updates and scaling due to a lack of detailed health signals. If your system only checks whether a service is running, it might send users to instances that are still starting up or unable to process requests.
By adopting RESTful endpoint patterns such as /health/live (liveness), /health/ready (readiness), and /health/started (startup), you provide orchestration tools with the clarity they need.
Liveness checks confirm the service isn’t stuck, readiness checks ensure it can handle traffic, and startup checks verify it has completed initialization.This separation is especially important during deployments and scaling events, reducing user-facing errors and improving deployment reliability.
During deployment and scaling, orchestration platforms use dedicated health endpoints to decide when an application has launched, when it can safely receive traffic, and whether it remains operational.
This process ensures that only fully initialized and healthy services are exposed to users, minimizing downtime and deployment risks.
A common frustration for business owners is the lack of actionable information when something goes wrong. Simple “healthy/unhealthy” responses don’t provide enough detail to resolve issues quickly.
Structuring health check responses with specific fields such as status, per component health, response times, and timestamps turns your health checks into powerful diagnostic tools.
This method allows automated microservice monitoring systems to trigger targeted alerts and helps engineers identify the root cause without digging through logs.
Standard health checks often miss failures in important business workflows, which can lead to hidden outages that damage customer trust. As an entrepreneur, your focus is on delivering value, not just running code.
Custom health checks can simulate real customer actions like placing an order or processing a payment to make sure your key services are working as expected. This proactive approach catches subtle failures early, before they affect users.
For instance, a leading ticketing platform implemented custom checks that verified ticket inventory updates and payment processing, catching integration issues before they could impact sales events.
Should microservices call a health check before making a request to other microservices?
While it might seem logical for one microservice to check another’s health before making a request, this approach isn’t recommended. The state of a service can change between the health check and the actual call, leading to unreliable results.
Instead, rely on strong error handling and retries within your business logic to manage temporary failures, ensuring resilience without unnecessary overhead.
Health checks are a foundation for reliable microservices. They help you spot issues early, automate recovery, and keep your services available important for any business owner focused on dependable operations and happy customers.
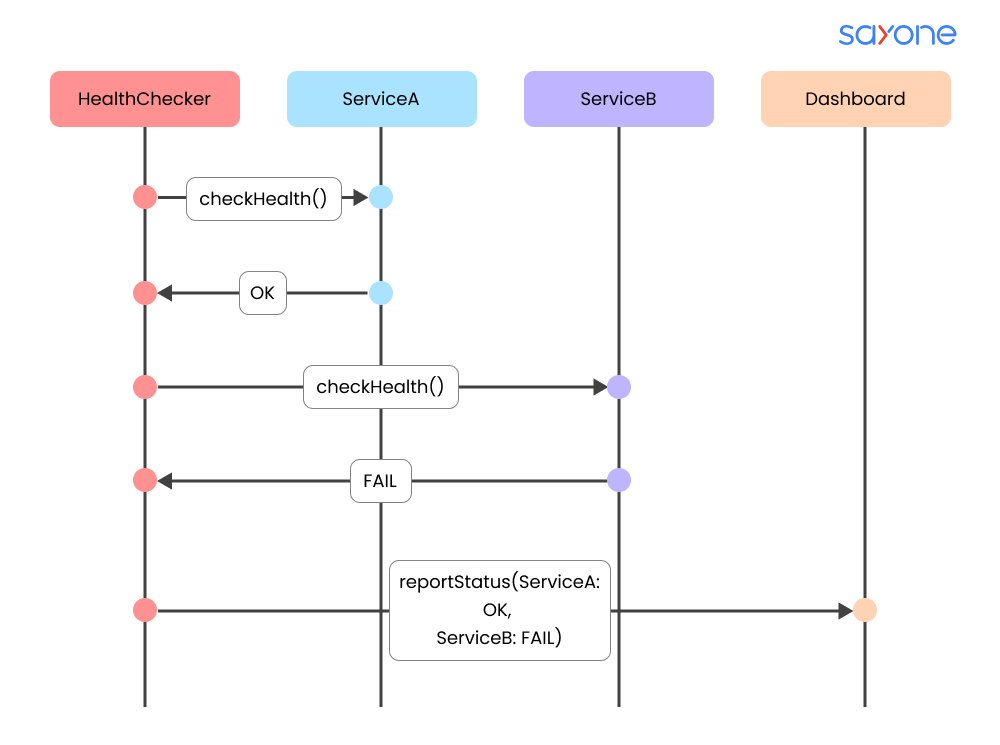
A health checker periodically polls individual microservices to verify their operational status. Each service runs internal checks and returns a simple success or failure signal. This aggregated information is then sent to a monitoring dashboard, allowing teams to see the real-time health of the entire system and quickly identify any failing components.
Many businesses face downtime that goes unnoticed until it disrupts users. Spring Boot Actuator solves this by providing a /actuator/health endpoint that collects health information from databases, caches, and other dependencies.
With both built-in and customizable indicators, you can adjust health checks to fit your business needs. Integration with monitoring tools means any anomaly triggers alerts and automated responses, helping you maintain uninterrupted service for your users.
Key Features of Spring Boot Actuator Health Checks
Silent failures in .NET microservices can erode user trust. AspNetCore.Diagnostics.HealthChecks lets you define clear health criteria for each dependency, from databases to APIs.
This proactive approach ensures issues are found and fixed before they impact your customers. The library allows you to set up a dedicated health endpoint that your container orchestrator, such as Kubernetes, can check.
By specifying checks for critical systems, you enable automated restarts and smart traffic routing, keeping unhealthy instances from serving requests.
Monitoring is necessary when managing Java EE microservices, as a lack of transparency can lead to undetected problems.
MicroProfile Health allows you to implement detailed health checks that assess the status of your service and its dependencies. These checks provide valuable feedback to your orchestration platform, making it possible to automate recovery steps and maintain steady service delivery.
This approach helps ensure that issues are addressed promptly, reducing the risk of extended outages and supporting a stable operational workflow.
At SayOne, we believe effective health checks are foundational for any microservices architecture. By integrating these checks within popular frameworks, businesses gain the ability to automate resilience, ensure continuous service availability, and ultimately build user trust.
Integrating health checks with orchestrators forms the backbone of resilient microservices architecture.
These checks allow for automated recovery, smart traffic routing, and smooth scaling, ensuring your business remains responsive as complexity increases.
During the container lifecycle, liveness and readiness probes continuously monitor application health. While liveness probes confirm the app is running, readiness probes ensure it’s prepared to serve traffic, preventing premature routing and reducing downtime as the application transitions from startup to operational.
Many entrepreneurs face unpredictable service failures that disrupt customers. Kubernetes solves this by letting you define liveness and readiness probes for each container.
Liveness probes restart failed containers, while readiness probes ensure only healthy services handle traffic. This self-healing setup reduces downtime and manual intervention, allowing your team to focus on new features.
Global platforms such as Spotify use these probes to maintain uninterrupted service, keeping millions of users engaged.
For business owners seeking broad oversight, Azure Service Fabric collects health signals from all microservices, presenting a unified view for proactive monitoring.
This advanced health model supports quick detection of issues and automated mitigation, such as rolling back problematic deployments or adjusting resources as needed. These capabilities help maintain customer trust and keep operations running smoothly as your platform grows.
As service ecosystems expand, reliable discovery and routing become essential. Service registries keep real-time records of healthy instances, while load balancers use this information to direct requests only to responsive services. This ensures high availability and a consistently positive experience for your customers.
Read more on : Load Balancing Microservices Architecture Performance
Monitoring and visualization are the backbone of a reliable microservices architecture, helping you quickly spot and resolve issues before they impact your customers.
As your business grows, manually tracking each service’s health becomes overwhelming, making centralized monitoring essential for operational success and reliability.
A modern microservices platform usually connects client applications, API gateways, and multiple backend services, with centralized health monitoring services collecting real-time status from all components.
Health check endpoints, watchdog services, and dashboards work together to provide clear visibility, proactive alerting, and rapid troubleshooting across the entire system.
When your platform expands beyond a handful of microservices, keeping tabs on each one individually is a recipe for missed problems.
As an entrepreneur, you need a watchdog service that automatically collects health data from all your services, offering a unified view of system health. This approach saves time and ensures that no failing service goes unnoticed, even as your architecture evolves.
In eShopOnContainers, a watchdog web page displays real-time health across all microservices, allowing the team to act quickly and maintain high availability.
How do you monitor the health of microservices in production?
Most organizations use centralized watchdog services that regularly query health endpoints across all microservices. These watchdogs gather the results, display them on dashboards, and can trigger alerts or automated remediation actions, ensuring issues are detected and addressed before they affect users.
Setting up visual dashboards lets you see the health status of every service at a glance, using clear indicators like green for health and red for failures.
Pairing dashboards with automated alerts ensures you’re notified instantly about issues, so you can respond proactively and minimize downtime. This combination turns raw health data into actionable insights, keeping your business running smoothly.
Spotting issues is only half the battle your microservices must recover quickly to ensure your business remains reliable and responsive. Effective troubleshooting and automated remediation are now necessary as distributed systems grow in complexity and scale.
We're committed to your privacy. SayOne uses the information you provide to us to contact you about our relevant content, products, and services. check out our privacy policy.

We collaborate with visionary leaders on projects that focus on quality