
Subscribe to our Blog
We're committed to your privacy. SayOne uses the information you provide to us to contact you about our relevant content, products, and services. check out our privacy policy.


Generating table of contents...
Whether you are using an application or a tool, it’s vital to make sure that they are working as intended. Kubernetes performs health checks, also known as probes, to know if they are responsive and are receiving traffic. For the application to run correctly, health checks are, therefore, critical. During a health check, the application or tool works in a manner to check its components and dependencies. The application then publishes a notification method if a problem is encountered during the check.
In this article, we attempt to familiarize ourselves with Kubernetes health checks and readiness checks, how to implement an effective health check method, and why health checks are important in troubleshooting.
When you are using traditional methods of deploying apps in virtual machines (VMs), health checks have to be configured on the load-balancer side. This means that you give the load balancer the liberty to add/remove machines from its configuration and manage traffic.
Read our blog “How Kubernetes Changed The Face Of The Cloud”.
Health checks are also important when using Kubernetes to ensure that containers are running as they have to. A single pod can have multiple health checks for different containers running in the pod. Readiness checks were not performed in the past when traditional cluster management tools such as Apache Mesos were used. Readiness checks help to manage traffic by routing traffic to the pod only if the check passes. Now, they are a very important part of Kubernetes and perform this role.
Health Check – Points to be noted
In a health check, you have to define the endpoint, timeout, interval, and a grace period.
Endpoint/CMD: This is the URL or CMD that you want to call/execute to verify the health check. An HTTP 200 status code is a healthy number. A system command 0 exit status code indicates successful termination of the program (without error or interrupt). For a TCP connection, in case the application is accepting the connection, then it is live.
Interval is the time period lapsed between two health checks.
Timeout is the amount of time an entity that is performing a health check waits before determining that the check is a failure.
Download our eBook for FREE “Choose the best microservices vendor and trim the costs."
The grace period is the time that you wait once the application starts running and the health check will start.
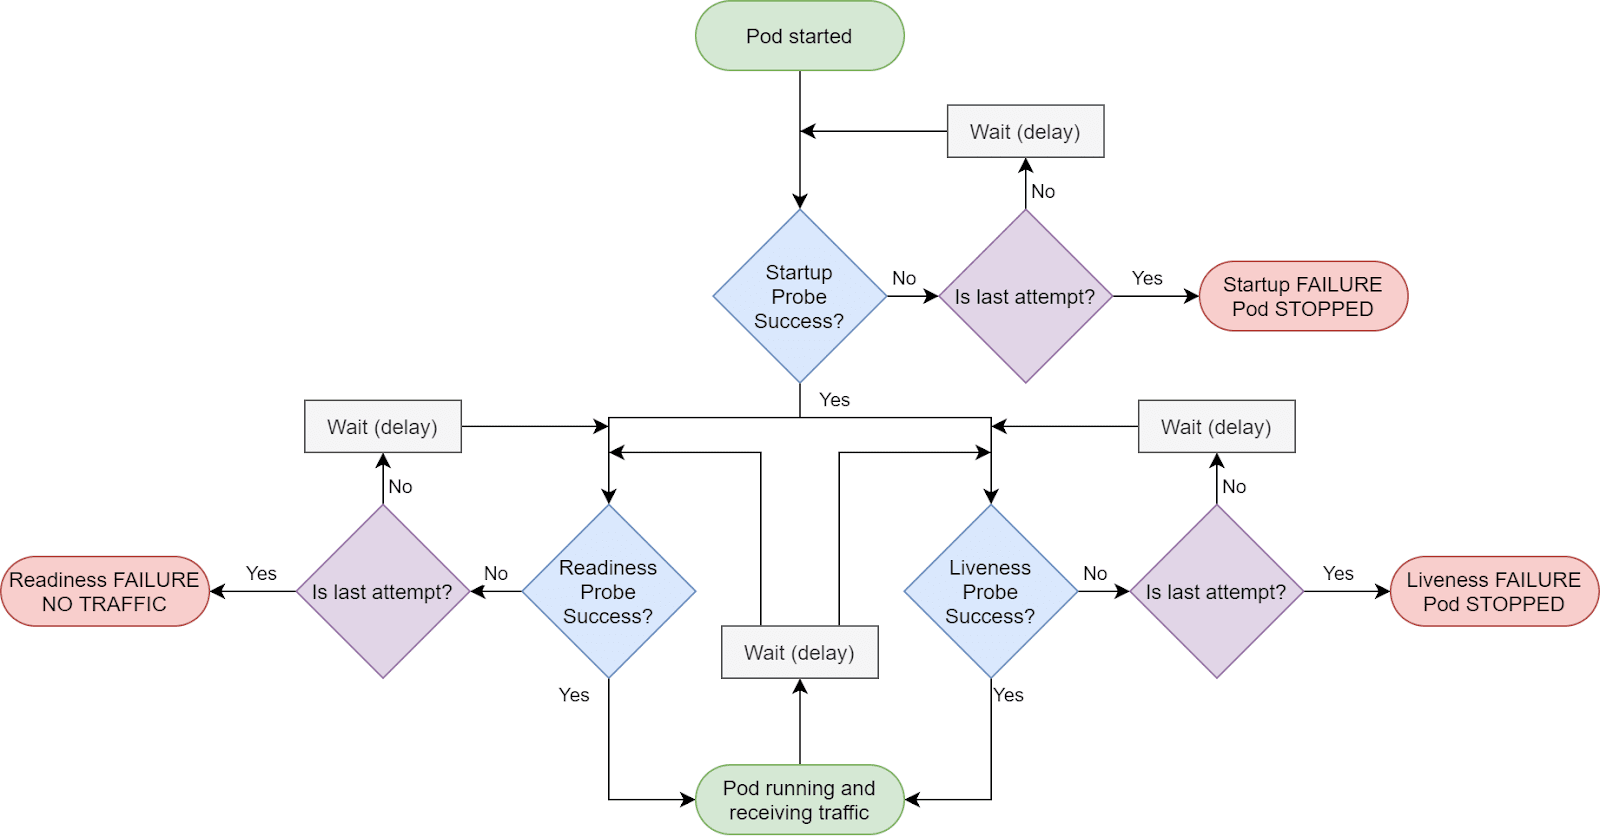
Kubernetes performs kinds of health checks: liveness and readiness probes. Whereas a liveness probe tells you that the application has started and is running, the readiness probe tells you that the application is in a position to accept traffic.
If the liveness probe detects any unhealthy state in a container, it tries to redeploy the container after killing it. This probe is configured in spec. containers.
Kubernetes’ startup probe, protects the containers that start slowly. The different types of liveness/readiness probes are:
The following is an example of putting a health check in HTTP mode:
apiVersion: v1
kind: Pod
metadata:
labels:
test: liveness
name: liveness-http
spec:
containers:
- name: liveness
image: k8s.gcr.io/liveness
args:
- /server
livenessProbe:
httpGet:
path: /healthz
port: 8080
initialDelaySeconds: 3
periodSeconds: 3
The above example is coded to indicate the liveness probe set on the /healthz endpoint on port 8080 after a delay of 3s and an interval of 3s.
For other methods of conducting health checks, you can check out the Kubernetes health check syntax.
Do you want to deploy, manage, and scale up your mobile/on-premise/cloud microservices applications? Call us today!
Each worker node in Kubernetes contains a component called a kubelet which is responsible for launching, managing, and deleting a pod. Kubectl is the component that performs a health check on the containers. The health checks are used to determine if the containers are running as desired or whether it has to kill the container.
The kubelet secures relevant information about the pods that have to be launched by talking to the API server in Kubernetes and also informs the API server if there have been any pod terminations. If the kubelet goes down, for a short duration of a few minutes, the nodes may go into a ‘Not Ready’ state, and all the pods may then be relaunched at another node.
Health checks enable faster troubleshooting. Let us examine the following example. Consider an application deployment and a service (in front of the deployment) to balance the traffic.
If you do see the application executing, you will start troubleshooting by initiating the health check. A properly set up health check will kill application pods that fail the health check and you can place an alert on the pod status stating that those application pods are failing the health check.
How Kubernetes Works to Support Microservices Architecture
Sometimes, it can happen that an application will pass a health check and the application pods come up. However, the application may still not be receiving any traffic. This can happen if the readiness check that you may have implemented is not successful. If in case the readiness check is failing, Kubernetes would not have added your pods to the service endpoint and, therefore, your service will not have any pods to which it can send traffic.
Some commands that can help you debug issues more quickly are given below.
The command below will help you to see if your containers are up and running. This command will show how many pods are up in the deployment.
kubectl get deployment deployment_name -n dep_namespace
In case you see that the pods are not up, you can look at the deployment descriptions/events using the following command. This will display the number of pods that are up in the replica set.
kubectl describe deployment deployment_name -n dep_namespace
You can then take the replica set name and check what is happening in the ReplicaSet events. This will display any issue that you may have in bringing up your pods.
kubectl describe replica set replicaset_name -n dep_namespace
You can describe your pods to determine if they are failing the health checks.
kubectl describe pod pod_name -n dep_namespace
You can look at the pod’s logs to determine why it failed in the health checks, using the below-said command.
kubectl logs -f pod_name -n dep_namespace
Checking the events in deployments, replica sets, pods, and pod logs will provide a lot of information on any issues that are waiting to happen. In case you are running StatefulSet, you can use the same commands for troubleshooting as well.
It is also possible to check if the endpoint object in the service has your pod IPs.
kubectl describe service service_name -n dep_namespace
You can view your instances attached to the load balancer if you have that service. In case your health check is failing, the instances will be removed by the load balancer, and traffic will not be forwarded to the instances.
Kubernetes events assume a lot of importance during troubleshooting. In a majority of cases, you will be able to spot the issue in any one of the Kubernetes events. By using the Kubernetes ‘describe’ command, you can easily see events related to any Kubernetes object.
Health Check – Common Pitfalls
You may run into several common pitfalls when running Kubernetes health checks. Some of them are as follows:
HTTP applications cannot have TCP health checks, as they will likely mark your application as healthy on port binding, even if the actual HTTP service is not running. Writing a proper health endpoint, where you should check the application’s dependencies and then make it live would help.
Servers should always have readiness checks installed in them. This ensures that the application does not prematurely receive any traffic it cannot serve.
Read our blog : How Kubernetes Changed The Face Of The Cloud
It is important to avoid TCP health checks for databases like Redis. Redis can be live when its server is running; however, this does not mean that Redis has joined the cluster, started as a master-slave, or reached its final configurations. Here, the liveness command interface can be used to ensure that Redis or the databases are in the desired state.
It is important to avoid verifying dependencies (in your health check) that are not required for the application to be running. It is also important to avoid health check loops. As an example, if application X needs both applications Y and Z to be online, and Z also needs X to be online, if one application goes down, they will altogether go down being dependent on one another.
Conclusion
Health checks are important for any application. The best part is that health checks are easy to implement and, when done properly, will help you to troubleshoot issues faster. If you log exactly why a health check failed, you can easily pinpoint and solve the issues quickly.
We believe in long-term win-win relationships with our strategic partners. If you want to migrate to microservices, call us today!
At SayOne, we offer independent and stable services that have separate development aspects as well as maintenance advantages. We build microservices specially suited for individuals' businesses in different industry verticals. In the longer term, this would allow your organization/business to enjoy a sizeable increase in both growth and efficiency. We create microservices as APIs with security and the application built in. We provide SDKs that allow for the automatic creation of microservices.
Our comprehensive services in microservices development for start-ups, SMBs, and enterprises start with extensive microservices feasibility analysis to provide our clients with the best services. We use powerful frameworks for our custom-built microservices for the different organizations. Our APIs are designed to enable fast iteration, easy deployment, and significantly less time to market. In short, our microservices are dexterous and resilient and deliver the security and reliability required for the different functions.
We're committed to your privacy. SayOne uses the information you provide to us to contact you about our relevant content, products, and services. check out our privacy policy.

We collaborate with visionary leaders on projects that focus on quality